14 Key Chatbot Metrics: A Guide to Tracking Success
The right metrics can reveal hidden opportunities for optimization, highlight potential bottlenecks, and ensure that your chatbot delivers not just interactions, but meaningful, value-driven engagements. We've highlighted the topic of chatbot metrics and KPIs you need to track to ensure chatbot success. Here you will find the 14 most important metrics as well as chatbot benchmarks to keep an eye on.
Chatbots are not the "set and forget" thing like many other software. If you want to achieve great results with your chatbot, you need to improve it constantly. (In case your chatbot operates in the customer support field, check out our research on how to improve customer service automation.)
Moreover, tracking chatbot performance isn't just about knowing how many conversations they handle or how quickly they respond. It is about diving deep into analytics and chatbot metrics to understand how effectively these virtual assistants meet user needs, align with business objectives, and adapt to ever-changing consumer expectations. We've shared our 8+ years of experience in chatbots and tell you about the crucial metrics and chatbot benchmarks to keep an eye on.
Let’s dive in!
Which Chatbot Metrics Matter Most?
The important thing to understand is that you don't need to track all of them. Some of these chatbot KPIs may be redundant for your industry or use case. Therefore, don't worry if not all of these metrics will suit your chatbot. We indicated which chatbot success metrics are best suited for each use case for your convenience.
General chatbot metrics
- Total number of users
- User satisfaction
- Accuracy of the chatbot
Engagement metrics
- Active users
- New users
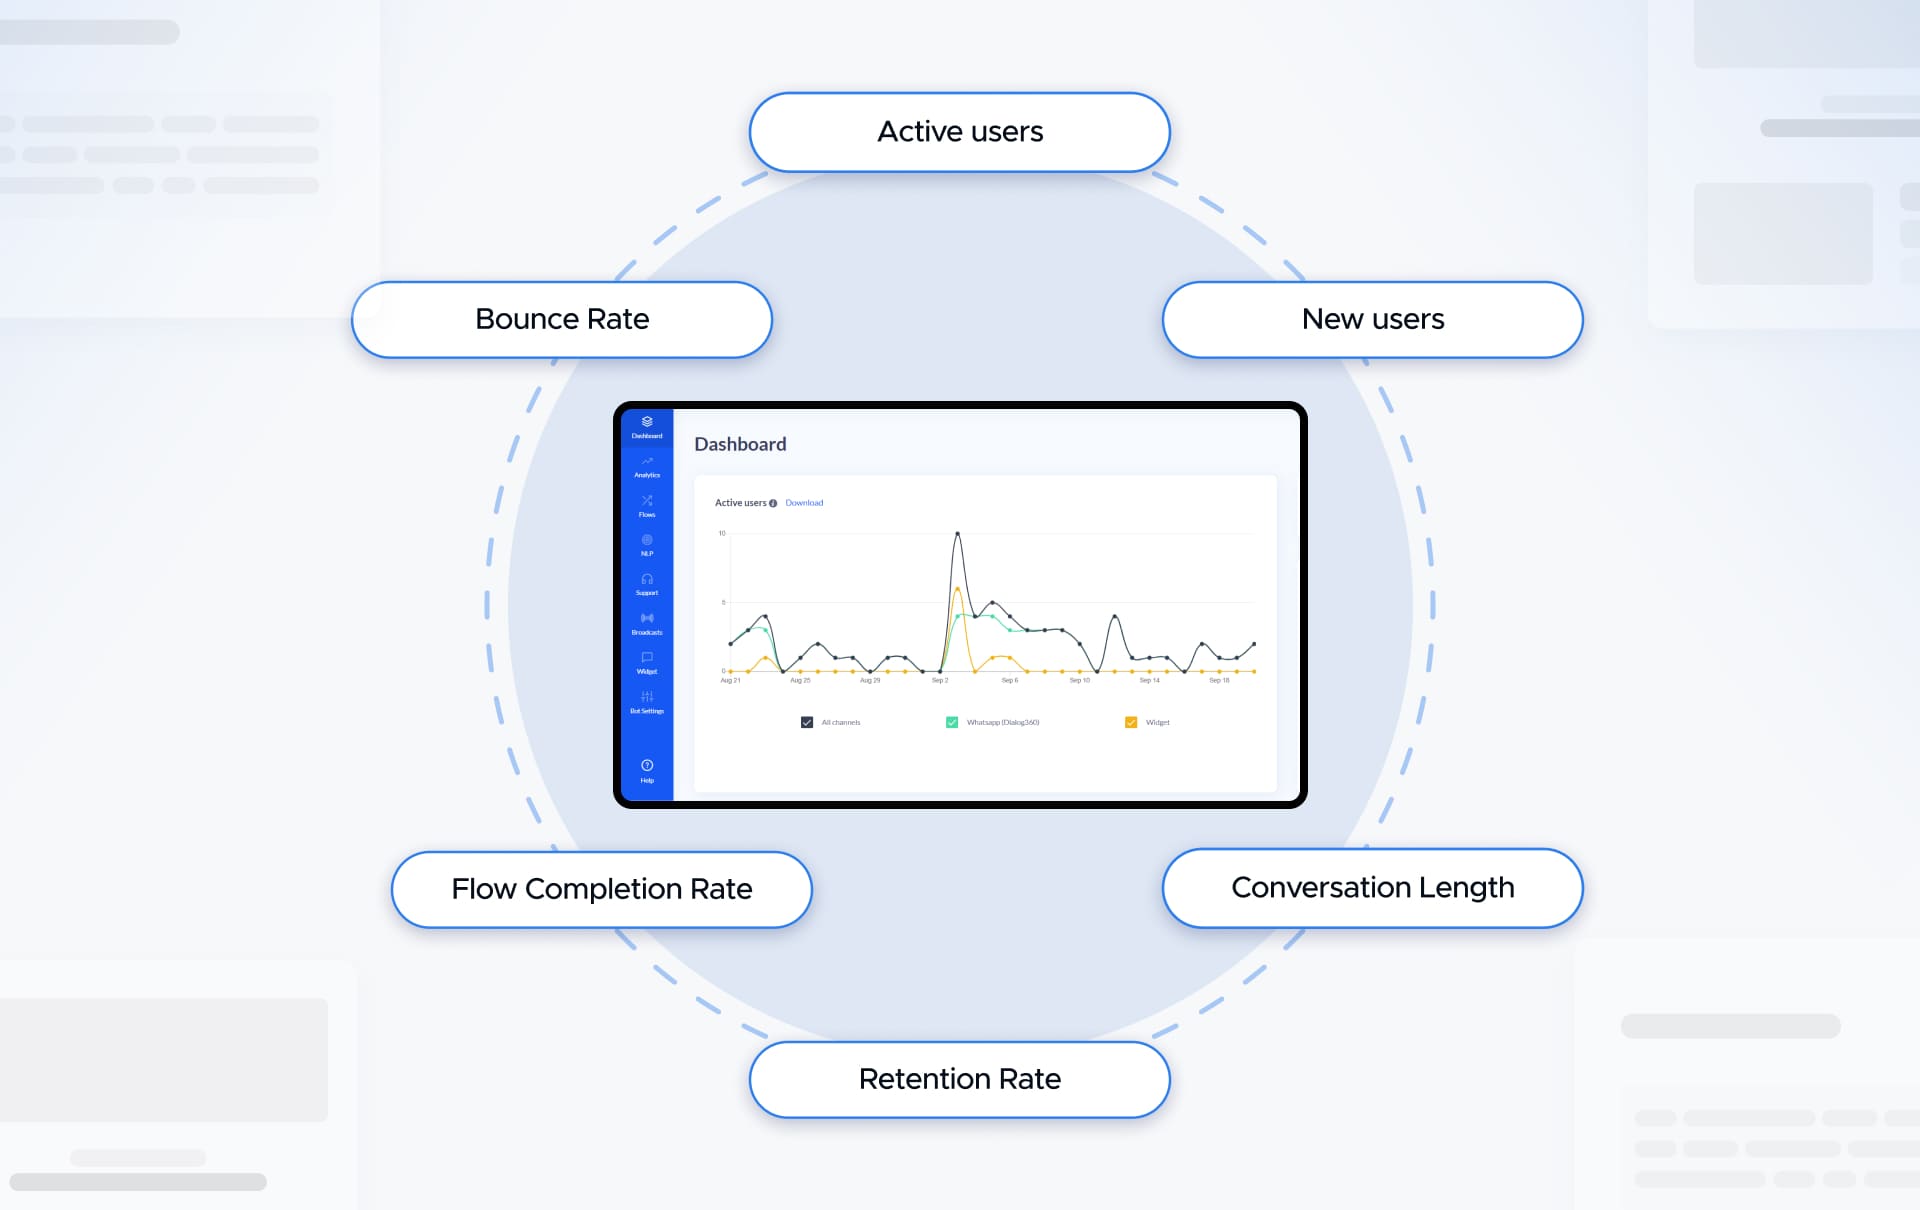
- Conversation Length
- Retention Rate
- Bounce Rate
- Flow Completion Rate
Conversational analytics
- Goal Completion Rate (GCR)
- Fallback Rate
- Human Takeover Rate
* Bonus: Revenue metrics
- Revenue generated
- ROI / payback period
General Chatbot Metrics
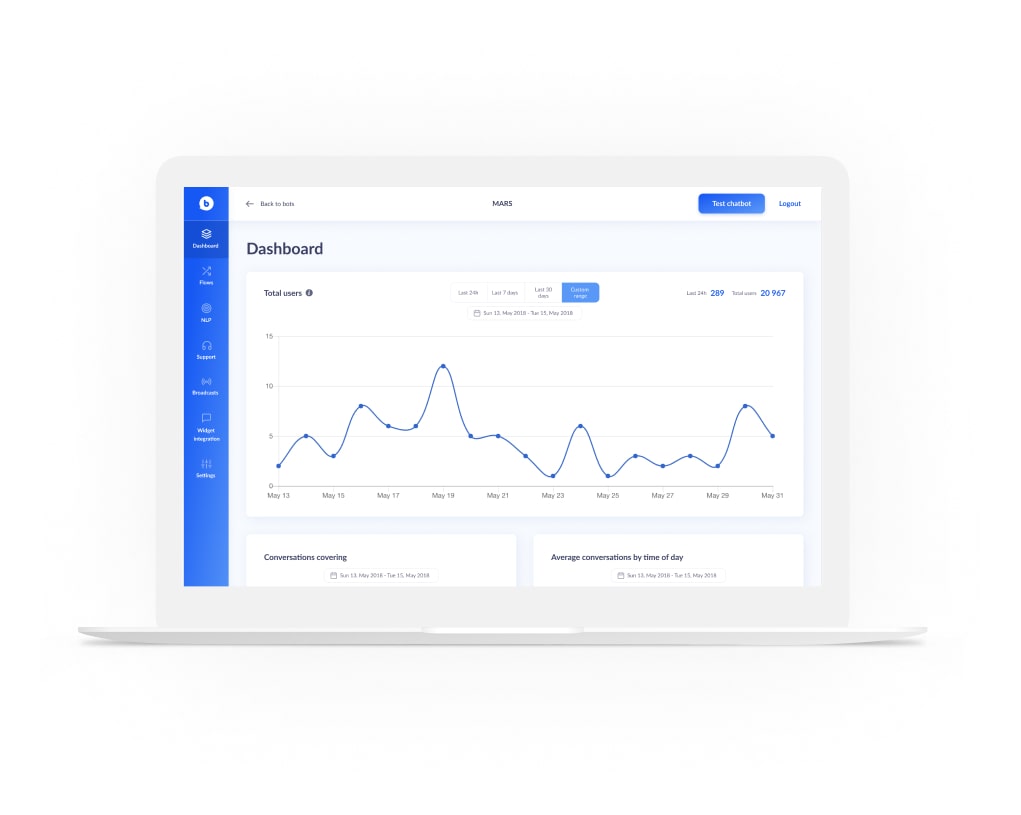
Total number of users
Use case: Customer service, Marketing, Sales
Importance: High
One of the simplest yet most telling metrics is your chatbot's overall usage. This chatbot KPI not only gives you a clear snapshot of how popular and useful your chatbot is but also serves as a stepping stone for calculating deeper insights. For instance, if your chatbot operates on your website, you can leverage this data to determine its conversion rate.
Imagine taking the total number of chatbot users in 2025, dividing it by the total number of website visitors, and uncovering just how "appealing" your chatbot is to your target audience. It is a straightforward calculation with significant implications, painting a picture of your bot's ability to engage and attract users. Here is how that formula looks:
You had 50,000 website visitors in 2024, and you had 6,000 chatbot users in 2024. You need to divide your chatbot users by website visitors – 6000/50000 = 0.12, then multiply your result by 100 – 0.12*100 = 12%.
This result is your conversion rate from a website visitor to a chatbot user. If this conversion rate is very low it may mean that chatbot looks unattractive, your welcome message looks unengaging, or simply users don't notice your bot because of the website or widget design.
User Satisfaction
Use case: Customer service, Marketing, Sales
Importance: High
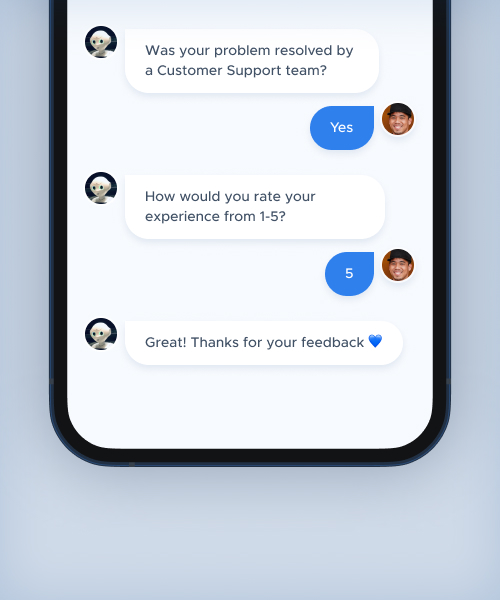
The user satisfaction metric shows how users rate your chatbot and if they find your chatbot useful or engaging. Typically, this can be achieved through post-conversation surveys or by integrating satisfaction prompts during key moments of the interaction.
For example, you might ask users to rate their experience after resolving an issue or completing a purchase. However, it's important to strike a balance — bombarding users with surveys or rating requests can lead to frustration and diminished engagement. Instead, focus on the critical junctures where feedback matters most.
These could be after a successful transaction, resolution of a support ticket, or the end of a meaningful conversation. By targeting these pivotal moments, you will gain valuable insights without overwhelming your users, ensuring that their experience remains seamless and enjoyable.
Accuracy of a chatbot
Use case: Customer service, Marketing, Sales
Importance: High
This metric is relevant only for AI and NLP-powered chatbots. These chatbots allow users to type in their requests, questions, and answers manually. They interpret user input and provide a response using Natural Language Programming skills. AI and NLP-powered chatbots require constant training.
That is why you need to measure their accuracy. With rule-based chatbots, you don't need to focus on the accuracy metric because they provide users with buttons and strictly pre-defined flows to communicate with them. If appropriately built, there can't be any inaccuracies with rule-based chatbots.
The accuracy of the chatbot KPI answers 2 questions:
- Did the chatbot understand what the user was writing?
- Did the chatbot provide the correct answer?
Accuracy is the baseline requirement of your AI-powered chatbot. Without it, hopes of reducing customer friction and accelerating revenue aren’t realistic.
How to calculate the accuracy of a chatbot?
The easiest way is to check the total number of messages sent from the chatbot and check how many of them were Fallback messages. Deduct Fallback Messages from the total number of messages, then divide the number you got by the number of total messages and multiply it by 100.
Here is an example:
You got 8,000 messages. 750 out of those messages were fallback messages.
So, here’s what you do:
8,000 - 750 = 7,250
7,250/8,000 = 0,906
0,906*100 = 90,6%
90,6% is your accuracy score in this example.
What is good accuracy for a chatbot?
We recommend aiming for an 80% or higher accuracy score.
Engagement Metrics
Active users
Use case: Customer service, Marketing, Sales
Importance: High
This metric captures the number of unique users who send a message within a specific time frame. Beyond simply monitoring total users, you can focus on tracking active users alone or calculate the percentage of active users relative to the total user base. This offers a more comprehensive view of user engagement.
Let's say your platform has 10,000 total users. Over the past week, 2,500 of them sent at least one message.
- The count of active users is 2,500.
- To get the percentage of active users, divide 2,500 by 10,000 and multiply by 100: (2,500 ÷ 10,000) × 100 = 25%.
This means 25% of your total users were actively engaging with your platform that week, providing a clearer insight into user activity.
New users
Use case: Marketing
Importance: Medium
This metric highlights the count of unique users engaging with your bot for the very first time within a given time frame. Tracking new users offers valuable insight into the success of your marketing initiatives or promotional efforts — such as when you roll out a fresh ad campaign spotlighting your chatbot.
Imagine you run a chatbot and recently launched an ad campaign to attract new users. Over the past month, 1,000 unique users interacted with your bot for the first time.
This "new users" metric shows the direct impact of your campaign. If, prior to the campaign, you typically gained around 400 new users per month, the increase to 1,000 demonstrates a clear boost in engagement, allowing you to measure the effectiveness of your marketing strategy.
Returning users
Use case: Customer service, Marketing, Sales
Importance: High
Returning users are those who have interacted with your chatbot before and come back for more. A higher number of returning users is a great sign — it indicates that your chatbot is not just catching attention but also delivering value and keeping users engaged.
For instance, over the past month, 3,000 users interacted with your chatbot for the first time. Out of those, 1,500 came back to chat again.
This means you have a 50% returning user rate, showing that half of those who tried your bot found it useful enough to return. This is a strong indicator of the bot's ongoing value and user satisfaction.
Average conversation duration
Use case: Customer service, Marketing, Sales
Importance: Medium
This chatbot KPI shows the total duration of all conversations (in seconds) during a specified time frame by the total number of conversations during that same time frame.
Conversation duration measures the time from a user's first message to the chatbot's final reply, and it is calculated once the conversation wraps up. This metric doesn't have a one-size-fits-all benchmark, as it varies widely. A longer conversation duration isn't necessarily a win — it could suggest that the chatbot is complex and users need more time to find what they are looking for.
On the flip side, shorter conversations don't mean the chatbot is underperforming. Users might be quickly getting the info they need, or the conversation flow could be designed to be brief. Therefore, it is best not to base major decisions solely on this metric.
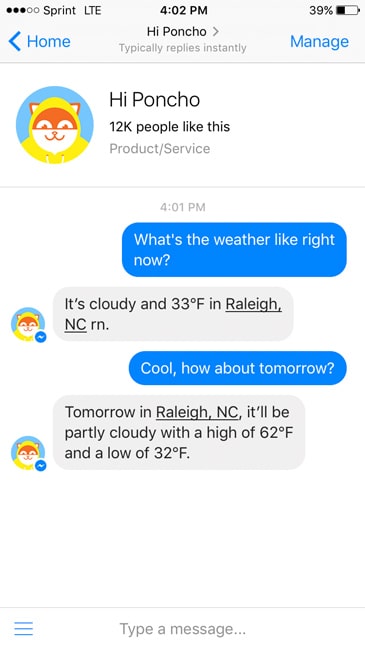
For example, a Facebook chatbot Poncho provides information about the weather. Usually, its conversations with users can be concise, but having long conversations wasn't its goal.
Bounce Rate
Use case: Customer service, Marketing, Sales
Importance: High
Bounce rate is the percentage of users who enter the chat and leave without interacting with the chatbot. The goal is to keep this rate as low as possible. Imagine 5,000 users visit your chatbot, but only 1,500 actually interact with it, while the remaining 3,500 leave immediately without engaging.
To calculate the bounce rate:
(3,500 ÷ 5,000) × 100 = 70%.
This means your bounce rate is 70%. A high bounce rate like this suggests that users are not finding what they need right away or aren't motivated to interact with your chatbot. It could be a sign to evaluate how the chatbot presents itself or how quickly it responds to user needs.
Flow completion rate
Use case: Customer service, Marketing, Sales
Importance: High
The flow completion rate measures the percentage of users who entered a flow, followed through all the steps, and received the final message. This metric is valuable because it shows how effective your chatbot is in guiding users through the entire process without them dropping off.
To calculate it, divide the number of flow completions (users who finished the flow) by the number of flow initializations (users who started the flow) and multiply by 100 to get the percentage. A higher completion rate suggests that your flow is clear, engaging, and provides the right information or outcomes to users.
Let's say you run a chatbot with a 5-step flow designed to guide users through booking a service. Over the course of a week, 4,000 users begin the flow, and 3,200 successfully complete all 5 steps and receive the final confirmation message.
To calculate the completion rate:
(3,200 ÷ 4,000) × 100 = 80%.
This means 80% of users who started the flow completed it. If the completion rate were lower, you might want to look at where users are dropping off and optimize those steps to improve engagement.
Conversational Analytics
Goal Completion Rate (GCR)
Use case: Customer service, Marketing, Sales
Importance: High
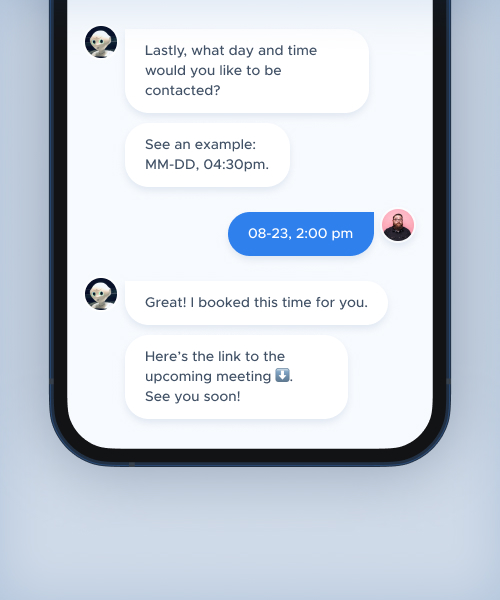
This chatbot metric captures the percentage of successful engagement through a chatbot. GCR indicates how many of your users reached their or your goals. For example, your goal could be for a user to finish the chatbot flow, subscribe to your services, book a meeting with you, resolve a customer issue, etc.
The GCR metric shows how successful your chatbot was in helping users reach these goals. If your GCR is low, don't panic just yet. Try to find the reason why the chatbot isn't reaching your goals. Maybe the conversational flow is too confusing or lengthy. Perhaps the goal you set isn't naturally expected or logical at that point. Just analyze your user chatbot journey, and you might find what's stopping your users from reaching the goals you designed.
Imagine you are using a chatbot for customer service, and your goal is for users to resolve their issue through the chatbot without needing to contact a human representative. Over the course of a month, 10,000 users interact with the chatbot. Out of those, 6,500 successfully resolve their issue and complete the flow, while 3,500 drop off before resolving anything.
To calculate the Goal Completion Rate (GCR):
(6,500 ÷ 10,000) × 100 = 65%.
This means 65% of users achieved the goal of resolving their issue through the chatbot. If the GCR is lower than expected, it's better to investigate the chatbot's flow. For instance, users could be getting stuck on a particular step, or the chatbot might not be providing clear enough options to guide them to a resolution. Adjusting the conversation to make it simpler or more intuitive could increase the GCR.
Fallback Rate
Use case: Customer service, Marketing, Sales
Importance: High
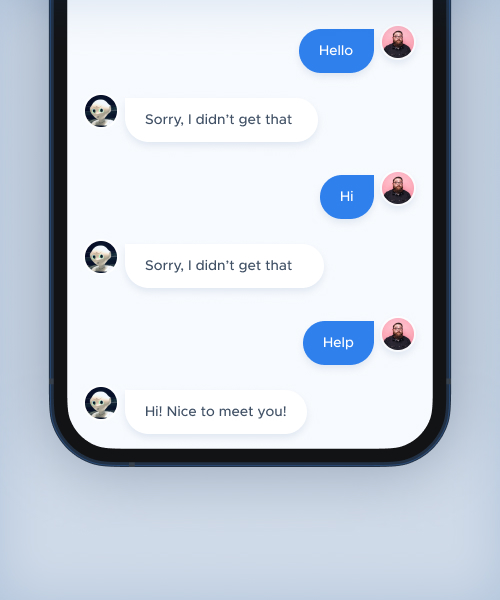
This metric tracks the percentage of messages where the bot either failed to understand the user's intent or could not provide a relevant answer to their question. It's a crucial metric to track because it highlights gaps in the bot's capabilities, helping you identify areas where it struggles and needs improvement. A high percentage may indicate that the bot needs more training or adjustments to better handle certain types of queries.
To calculate the percentage of failed responses, use the formula:
(Failed responses ÷ Total user messages) × 100.
For example, if there were 10,000 messages and 1,200 were failed responses: (1,200 ÷ 10,000) × 100 = 12%.
This means 12% of the messages had no meaningful answer, showing where the chatbot needs improvement. Also, monitor all messages sent to the chatbot. Each message can either be categorized as a successfully answered query or a failed one (where the bot could not understand the user's intent or provide a relevant response).
Track this metric over time to identify patterns and recurring types of failure, such as certain topics or phrases the bot struggles with. This will guide you in improving the chatbot's training data or response flow.
Human Takeover Rate (HTR)
Use case: Customer service
Importance: High
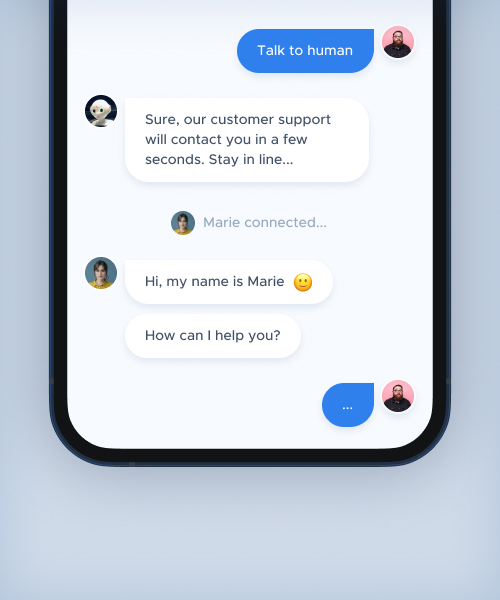
This metric measures how often your human agent had to jump in the conversation to help the user. For example, if your agent noticed that the user is getting "Sorry, I didn't get that" or "It seems like I can't help you with that" chatbot reply, your human agents can connect to the conversation and help the user from there.
If your HTR is too high, you need to train your chatbot more, as it doesn't reach its goals. However, in some cases connecting to a human is a logical and expected next step, for example, if you want your users to chat with your sales or other professionals.
Revenue-Oriented Chatbot KPIs
Revenue generated
Use case: Marketing, Sales
Importance: High
If your chatbot's primary goal is sales, it can bring revenue to your business. By calculating chatbot ROI, you can measure how much revenue was brought by a chatbot.
The chatbot can make sales directly during the chat with the user (common for e-commerce chatbots) or transfer the user to a human sales agent who closes the deals. In both those cases, the chatbot helped you generate revenue, and it's better to track these results. Also, this revenue-generated metric allows you to calculate the next chatbot KPI we will talk about — ROI.
ROI / payback period
Use case: Customer Service, Marketing, Sales
Importance: Medium
This metric tracks the monetary value from the bot (for example, time saved for customers and support agents or customers brought by the chatbot). ROI is an important metric because it shows whether you should invest in future chatbot optimization.
To calculate the ROI, use the formula: ROI = (Monetary Value Generated – Total Investment) ÷ Total Investment × 100.
For example:
- Total investment: $50,000
- Monetary value generated: $120,000.
ROI = ($120,000 - $50,000) ÷ $50,000 × 100 = 140%.
This means for every dollar invested in the chatbot, you’ve gained $1.40 in return.
Chatbot Analytics Tools
At this point in the article, you may be wondering if you have to measure and keep track of all these chatbot metrics by yourself.
Well, first of all, many chatbot analytics tools can help you with that. Secondly, you probably have a chatbot analytics dashboard if you use a chatbot platform. Thirdly, if you use custom chatbot development services, you can talk to your chatbot developers to either set up this analytics dashboard or ask them to track these metrics for you.
Here are a few Chatbot Analytics Tools that you can use:
- Botanalytics
- BotCore
- BotExpress.ai
- ChatBot
- Chat Metrics
- Dashbot
- Kore.ai
But as we mentioned before, if you use or are planning to use a chatbot platform, first research the chatbot analytics dashboard they provide, as you may not need to set up additional analytics tools. And if you use chatbot vendors, check in with them which chatbot analytics tool they recommend and if they can set it up for you.
How Do I Optimize My Chatbot?
After you figure out which chatbot KPIs to track and what analytics tool to use and start keeping track of these chatbot KPIs, you need to optimize your chatbot based on those things.
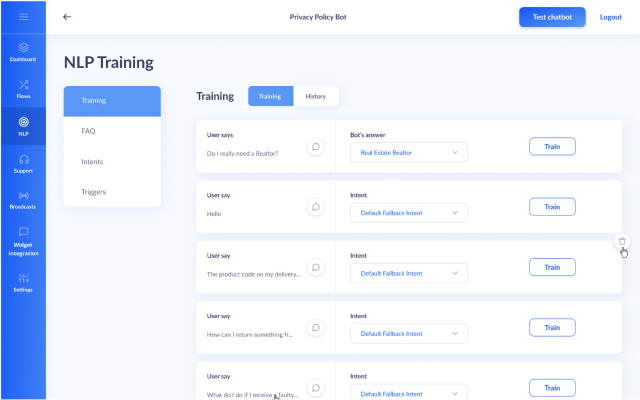
Depending on the chatbot success metrics that don't perform well in your chatbot, you'll have different optimization strategies. It often comes to training your chatbot and its NLP more or reviewing your conversational flow to make it simpler or more engaging. Check out our article on training chatbots for non-technical people to learn more about NLP training.
There is no universally applicable advice we could give you regarding chatbot optimization. It is better to talk to chatbot experts to reach the best results. Talking to experienced conversational designers or business analysts specializing in chatbots is the easiest and most effective way to improve your chatbot. You can book a free consultation with us if you'd like to get an expert view on chatbot and its KPIs.
Get your free table with 25+ chatbot metrics! All of the most important KPIs gathered in one place




![The Best Chatbot Platforms for Business [2025 Edition]](https://botscrew.com/wp-content/uploads/2018/07/photo-1522071820081-009f0129c71c-1.jpeg)
